1. Overview & Purpose
This playbook provides a structured, scenario-based framework for monitoring and responding to financial market disruptions caused by a sustained or intermittent closure of the Strait of Hormuz — the world's most critical oil chokepoint. Approximately 20–21 million barrels of crude oil and petroleum products pass through the strait daily, representing roughly 20% of global seaborne oil trade.
The playbook covers three escalating disruption scenarios, probabilistic price paths, hedging triggers, liquidity actions, insurance checklists, and regulatory contacts. It is designed for use by risk analysts, trading desks, corporate treasury teams, and risk officers. All outputs are research and scenario analysis only. Human review is mandatory before any action is taken.
2. Core Scenarios
Three scenarios are modelled. Each assumes a specific reduction in seaborne oil flows through the strait. Probability estimates are analyst judgements based on historical precedent and current geopolitical signals and should be reviewed weekly.
Partial Disruption
~20% reduction in seaborne oil flow. Intermittent harassment, mine-laying threats, or single vessel incidents. Markets price elevated risk premium without full closure.
| Attribute | Estimate |
|---|---|
| Duration assumption | 1–14 days |
| Analyst probability | 45–55% |
| Brent immediate spike | +$10–$18/bbl |
| LNG premium | +15–25% |
| Confidence | MEDIUM |
Severe Disruption
~50% reduction. Significant naval engagement or blockade enforcement. Major diversion of tanker traffic; SPR releases likely coordinated by IEA members.
| Attribute | Estimate |
|---|---|
| Duration assumption | 14–30 days |
| Analyst probability | 15–25% |
| Brent immediate spike | +$25–$50/bbl |
| LNG premium | +40–70% |
| Confidence | MEDIUM |
Prolonged Closure
90%+ reduction for 30+ days. Full blockade or sustained military conflict. Global recession risk; emergency IEA coordination; extreme freight dislocation.
| Attribute | Estimate |
|---|---|
| Duration assumption | 30–90+ days |
| Analyst probability | 5–12% |
| Brent immediate spike | +$60–$120+/bbl |
| LNG premium | +100–200%+ |
| Confidence | LOW |
3. Probabilistic Price Paths — Brent Crude (USD/bbl)
Percentile ranges (10th / Median / 90th) at 1, 3, and 6 month horizons under each scenario. Baseline Brent assumption: $75/bbl (May 2026 spot). All ranges are analyst estimates with high uncertainty. Do not use as single-point forecasts.
| Scenario | Horizon | P10 ($/bbl) | Median ($/bbl) | P90 ($/bbl) | Key driver | Confidence |
|---|---|---|---|---|---|---|
| S1 Partial | 1 month | 82 | 90 | 105 | Risk premium; minor rerouting | MEDIUM |
| 3 months | 78 | 83 | 96 | Diplomatic de-escalation vs. repeat incidents | MEDIUM | |
| 6 months | 72 | 79 | 91 | OPEC+ response; demand destruction | LOW | |
| S2 Severe | 1 month | 98 | 118 | 145 | SPR release lag; tanker rerouting 2–3 weeks | MEDIUM |
| 3 months | 88 | 105 | 130 | IEA coordination offsets ~30% of shortage | LOW | |
| 6 months | 80 | 93 | 115 | Demand destruction; alternative supply ramp | LOW | |
| S3 Prolonged | 1 month | 130 | 175 | 240 | Supply shock; panic premium; freight collapse | LOW |
| 3 months | 110 | 150 | 210 | Demand rationing; strategic reserves depleting | LOW | |
| 6 months | 85 | 120 | 180 | Recession-driven demand collapse partially offsets | LOW |
Sources (baseline): IEA Oil Market Report; EIA Short-Term Energy Outlook; S&P Global Platts crude assessments. Percentile ranges derived from historical volatility and precedent events (1973 Arab embargo, 1990 Gulf War, 2019 ARAMCO attacks). These are not predictions. Human review required.
4. Hedging Triggers
The following thresholds, when breached, should trigger a human analyst review and consideration of the hedging actions listed. None of these are automatic trade signals. All require sign-off from the trading desk and risk team before execution.
| Trigger Level | Metric / Signal | Threshold | Scenario Link | Recommended Review Action | Confidence |
|---|---|---|---|---|---|
| T1 — Watch | Brent spot price | > $88/bbl (intraday) | S1 | Review crude call option delta; assess existing hedges vs. exposure | MEDIUM |
| T2 — Elevated | Brent 1M futures spread | > $6/bbl backwardation | S1/S2 | Consider layering 3–6 month call spreads; review producer hedge ratio | MEDIUM |
| T3 — Alert | Brent spot price | > $110/bbl | S2 | Activate S2 playbook; review airline/transport fuel hedges; long crude calls | MEDIUM |
| T4 — Critical | AIS active tankers through strait | < 40% of 30-day average | S2/S3 | Activate S3 scenario review; escalate to risk committee; notify insurers | MEDIUM |
| T5 — Critical | Baltic Dirty Tanker Index (BDTI) | > 3× 90-day moving average | S2/S3 | Floating storage economics review; freight forward curve assessment | MEDIUM |
| T6 — Macro | IRGC/USN incident confirmed | Any confirmed naval engagement | All | Immediate risk committee escalation; full scenario activation; press pause on new exposure | HIGH |
| T7 — Insurance | War-risk premium (VLCC) | > 0.5% hull value/voyage | S1+ | Notify P&I clubs; review trade credit insurance; assess cargo coverage gaps | MEDIUM |
Instrument Menu for Analyst Review
The following instrument types may be relevant for review by the trading desk. This is not a recommendation to buy or sell any instrument. Suitability depends on entity mandate, credit lines, and regulatory authorisation. Human review and sign-off required.
- Brent crude call options (ICE) — upside protection for energy consumers; review delta and premium cost vs. budget
- WTI–Brent spread trades — monitor for unusual widening indicating US supply decoupling
- Freight forward agreements (FFAs) on VLCC dirty tanker routes (TD3C: Ras Tanura → Chiba)
- Natural gas / LNG swap instruments — review basis to JKM and TTF given Asian LNG supply exposure
- Energy sector equity options — review implied vol surface; consider sector-level hedges via ETF options
- USD/EM currency pairs — Gulf state FX and import-dependent EM currency exposures
- CDS on energy sector corporates and Gulf sovereign bonds — monitor widening as leading indicator
- Inflation-linked bonds (TIPS, UKTI, CAD RRBs) — energy-driven CPI pass-through hedge
5. Liquidity Actions
Scenario-linked liquidity steps for treasury and risk teams. Sequence matters: earlier steps preserve optionality without locking in costs. All actions require risk team and treasury sign-off.
Phase 1 — Pre-escalation (Trigger T1–T2 active)
- Run a 30-day liquidity stress test assuming energy sector margin calls increase by 2×
- Identify repo and credit facility headroom; confirm committed lines are undrawn and available
- Stress test MMF exposure — confirm no concentration in Gulf-region or energy-sector commercial paper
- Review commodity-linked loan covenants for price-based triggers or borrowing base redeterminations
- Pre-position FX liquidity in USD for potential Gulf-route freight and war-risk premium payments
Phase 2 — Elevated Scenario (Trigger T3–T5 active)
- Activate contingency credit lines (revolving credit facilities, bilateral bank facilities)
- Reduce short-dated exposure to energy sector CP and short-duration EM bonds in Gulf region
- Assess margin-call exposure for derivatives book under Brent $120, $150, $200 stress scenarios
- Coordinate with prime broker on repo haircut assumptions — anticipate potential haircut widening on energy collateral
- Notify custodians and clearing houses of elevated activity; confirm settlement capacity
- Review cash runway: ensure 60+ days of operating liquidity without external financing
Phase 3 — Crisis Scenario (Trigger T6 active / S3 conditions)
- Activate board-level crisis liquidity protocol; convene emergency risk committee
- Freeze non-essential capital deployment; defer discretionary investments
- Notify regulators (OSFI / Bank of Canada / relevant national authority) per regulatory reporting obligations
- Engage central bank liquidity facilities if available (emergency repo, swap lines)
- Prepare investor communication: identify material exposures for disclosure review with legal counsel
- Monitor money market fund redemption volumes — flag any redemption gate risk to risk committee
- Review trade finance book: identify letters of credit covering Gulf-region cargo routes and assess counterparty exposure
6. Insurance Checklist
War-risk and hull & machinery cover is the first line of financial defence for cargo owners and vessel operators. The following steps apply to corporate risk managers, ship operators, and trade finance teams. Verify with your broker and P&I club — this checklist is a starting point only.
Immediate Checks (Within 24h of Trigger T1)
- Confirm current war-risk cover for all vessels in or transiting the Persian Gulf / Gulf of Oman
- Review war-risk exclusion zones listed by underwriters — the Strait of Hormuz may be added to or already listed in JWLA/IWC exclusion clauses
- Identify any automatic termination clauses that activate on declared armed conflict or naval blockade
- Confirm cargo insurance cover (Institute Cargo Clauses A + War Clauses) and check for Persian Gulf exclusions
- Review trade credit insurance policies covering Gulf-origin or Gulf-routed shipments
Escalation Steps (Trigger T3–T6)
- Contact P&I club (e.g., Standard Club, Gard, Skuld, UK P&I) to confirm mutual cover status and notify of at-risk voyages
- Request war-risk premium quote for upcoming Gulf transits — document increase vs. pre-event baseline for cost tracking
- Assess insurer capacity: if premium exceeds 0.5% hull value/voyage, capacity may be constrained — seek Lloyd's of London syndicate alternatives
- Review export credit agency (ECA) cover if applicable: EDC (Canada), UK Export Finance, US EXIM — confirm political risk cover activation conditions
- Notify cargo charterers of potential war-risk additional premium (AWRP) pass-through under charter party terms
- Engage specialist war-risk broker (e.g., JLT Specialty, Marsh, Aon) for dedicated advice if premium market dislocates
- Document all insurance notifications and responses with timestamps for audit trail
Insurer Capacity Warning Indicators
| Indicator | Normal Range | Stress Threshold | Action |
|---|---|---|---|
| VLCC war-risk premium (% hull/voyage) | 0.025–0.075% | > 0.50% | Seek alternative capacity; notify CFO |
| Coverage refusal rate (broker survey) | < 5% | > 25% | Escalate to risk committee; review route alternatives |
| Lloyd's syndicate capacity utilisation | < 60% | > 85% | Monitor daily; explore P&I mutual top-up |
| AWRP pass-through disputes | Minimal | Any formal dispute | Legal review of charter party terms |
7. Shipping & Freight Impact Model
The following estimates are based on historical rerouting data (Suez–Cape of Good Hope), vessel speed assumptions, and published port queue data. AIS feeds should be cross-validated against satellite and terrestrial sources; flag any anomalies before use in alerts.
| Scenario | Rerouting Option | Additional Transit Days | Incremental Fuel Cost ($/voyage, VLCC) | Floating Storage Impact | BDTI Expected Change |
|---|---|---|---|---|---|
| S1 Partial | Hormuz with escort / convoy | 0–2 days | $20K–$80K | Minimal (0–5 Mbbls) | +50–100% |
| S2 Severe | Cape of Good Hope (Africa reroute) | 10–14 days | $800K–$1.5M | Moderate (20–50 Mbbls) | +150–300% |
| S3 Prolonged | Full Cape reroute + pipeline alternatives | 12–18 days | $1.2M–$2.5M | Large (50–150+ Mbbls) | +300–700% |
Pipeline Alternatives — Limited Capacity
- East–West Pipeline (Saudi Arabia): capacity ~5 Mbpd; currently operating below capacity — can absorb limited rerouting
- Iraq–Turkey (Kirkuk–Ceyhan): capacity ~0.9 Mbpd; currently operating; subject to Kurdish political risk
- UAE ADCO pipeline (Abu Dhabi → Fujairah): capacity ~1.5 Mbpd; bypasses strait; limited expansion headroom
- Combined pipeline bypass: maximum ~7.5 Mbpd vs. 20+ Mbpd strait flow — significant structural gap remains
AIS Monitoring Protocol
- Cross-validate vessel counts from at least two independent AIS providers (terrestrial + satellite)
- Flag vessels showing AIS gaps > 6 hours in the Persian Gulf / Gulf of Oman zone (spoofing indicator)
- Compare AIS vessel arrivals against port arrival logs at Fujairah, Kharg Island, and Ras Tanura
- Quarantine any AIS feed failing cross-validation; do not use in alert outputs until verified
- Maintain 30-day rolling baseline of daily active tanker count as denominator for percentage alerts
8. Second-Round Commodity Impacts
Energy disruptions propagate into downstream commodity markets through production costs, transport costs, and supply-chain dependencies. The following are key transmission channels to monitor.
| Commodity | Gulf Exposure | S1 Price Impact | S2 Price Impact | S3 Price Impact | Key Chokepoint |
|---|---|---|---|---|---|
| LNG | Qatar: ~25% global LNG exports | +15–25% | +40–70% | +100–200%+ | RasGas / QatarEnergy loading terminals |
| Ammonia / Urea | Gulf = ~20% global ammonia exports | +8–15% | +25–50% | +80–150% | Natural gas feedstock + export terminals |
| Aluminium | UAE (EMAL): ~5% global primary aluminium | +3–6% | +10–20% | +30–60% | Energy cost pass-through; Jebel Ali port |
| Methanol | Iran: ~10% global methanol; Saudi Arabia significant | +10–20% | +30–60% | +100%+ | Natural gas feedstock; strait transit |
| Petrochemicals | Saudi SABIC, EQUATE (Kuwait), INEOS Gulf | +5–10% | +15–35% | +50–100% | Naphtha feedstock + export logistics |
| Food / Grain | Gulf states are net importers via Jebel Ali | Indirect: +2–5% | Indirect: +8–15% | +20–40% | Freight cost pass-through; fertilizer link |
| Copper | Energy-intensive smelting; freight exposure | +1–3% | +5–12% | +15–30% | Global energy cost pass-through |
Sources: IEA Gas Market Report; USDA agricultural trade data; World Aluminium; ICIS petrochemical pricing. All ranges are analyst estimates. Confidence: Medium (S1–S2), Low (S3).
9. Financial Transmission — Stress Indicators
Energy price shocks transmit into financial markets through multiple channels. Monitor the following indicators as leading signals of systemic stress. All thresholds are illustrative and should be calibrated to your institution's specific exposures.
Equity Sector Stress
| Sector | S1 Expected Move | S2 Expected Move | S3 Expected Move | Primary Driver |
|---|---|---|---|---|
| Energy (E&P) | +8–15% | +20–40% | +50–100% | Crude price windfall |
| Airlines / Transport | −5–12% | −15–30% | −40–70% | Jet fuel cost spike |
| Petrochemicals | −3–8% | −10–25% | −30–60% | Feedstock cost + demand destruction |
| Utilities (gas-fired) | −4–9% | −12–22% | −30–50% | Gas input cost |
| Banks (energy lending) | Mixed | −5–15% | −20–40% | Loan quality; counterparty risk |
| Shipping / Tankers | +15–30% | +40–80% | +80–150% | Freight rate spike |
| Defence / Aerospace | +5–15% | +10–25% | +20–50% | Conflict escalation premium |
Credit & Margin Stress Indicators
- CDS spreads (energy sector IG): Monitor for widening >50bps above 90-day average — flag for credit review
- Repo haircuts (energy collateral): Widening beyond 5% indicates funding stress — monitor tri-party repo data
- MMF redemption flows: Outflows >2% of AUM in any single day — potential liquidity gate risk
- Leveraged fund margin calls: Estimate using open interest and price move; flag when Brent 5-day move >15%
- Gulf sovereign CDS (Saudi Arabia, UAE, Kuwait): Widening >100bps signals broader contagion risk
- Trade finance acceptance rates: Decline in confirmed LC issuance for Gulf routes signals bank pullback
- LIBOR/SOFR–OIS spread: Widening >30bps indicates bank funding stress entering broader market
Liquidity Stress Indicators (Daily Monitor)
10. Sample Daily Alert — JSON Format
The daily alert is produced as a JSON object conforming to the schema below, plus a plain-English summary. Each alert includes a confidence field with rationale. All alerts require human review before distribution. Source links and timestamps are mandatory fields.
{
  "alert_id": "HMZ-2026-05-09-001",
  "timestamp_utc": "2026-05-09T06:00:00Z",
  "classification": "RESEARCH ONLY — NOT INVESTMENT ADVICE",
  "human_review_required": true,
  "scenario_active": "S1-PARTIAL",
  "top_5_signals": [
    {
      "rank": 1,
      "metric": "brent_spot_usd_bbl",
      "value": 91.40,
      "threshold": 88.00,
      "change_pct": +4.2,
      "breach": true,
      "trigger_level": "T1-WATCH",
      "confidence": "HIGH",
      "confidence_rationale": "ICE futures settlement price; multiple venue corroboration",
      "source_primary": "https://www.theice.com/products/219/Brent-Crude-Futures",
      "source_corroboration": "https://www.spglobal.com/commodityinsights/en"
    },
    {
      "rank": 2,
      "metric": "ais_active_vlcc_hormuz_zone",
      "value": 62,
      "threshold": 75,
      "change_pct": -17.3,
      "breach": true,
      "trigger_level": "T1-WATCH",
      "confidence": "MEDIUM",
      "confidence_rationale": "Cross-validated terrestrial + satellite AIS; 3 vessels flagged spoofing-suspect and quarantined",
      "ais_anomalies_quarantined": 3,
      "source_primary": "https://www.marinetraffic.com",
      "source_corroboration": "https://www.spire.com/maritime"
    },
    {
      "rank": 3,
      "metric": "baltic_dirty_tanker_index_td3c",
      "value": 1840,
      "threshold": 1500,
      "change_pct": +22.7,
      "breach": true,
      "trigger_level": "T2-ELEVATED",
      "confidence": "HIGH",
      "confidence_rationale": "Baltic Exchange official daily assessment",
      "source_primary": "https://www.balticexchange.com",
      "source_corroboration": "https://www.clarksons.net"
    },
    {
      "rank": 4,
      "metric": "jkm_lng_spot_usd_mmbtu",
      "value": 16.80,
      "threshold": 14.00,
      "change_pct": +20.0,
      "breach": true,
      "trigger_level": "T2-ELEVATED",
      "confidence": "HIGH",
      "confidence_rationale": "S&P Global Platts JKM assessment; confirmed by ICE JKM futures",
      "source_primary": "https://www.spglobal.com/commodityinsights/en/market-insights/latest-news/lng",
      "source_corroboration": "https://www.theice.com/products/lng"
    },
    {
      "rank": 5,
      "metric": "saudi_sovereign_cds_5y_bps",
      "value": 95,
      "threshold": 80,
      "change_pct": +18.8,
      "breach": true,
      "trigger_level": "T2-ELEVATED",
      "confidence": "MEDIUM",
      "confidence_rationale": "Bloomberg CDS composite; single provider — corroboration pending",
      "source_primary": "https://www.bloomberg.com/markets/rates-bonds/government-bonds/us",
      "source_corroboration": "PENDING — flag for analyst review"
    }
  ],
  "summary_human_readable": "T1 and T2 thresholds breached on 5 of 5 monitored metrics. Brent at $91.40 (T1 active). VLCC AIS count down 17% vs. 30-day avg (3 vessels quarantined for spoofing). Baltic TD3C +23% from baseline. JKM LNG +20%. Saudi CDS +19%. Scenario S1-PARTIAL is active. Human review required before any action.",
  "next_review": "2026-05-10T06:00:00Z",
  "version": "1.0",
  "provenance": "Hormuz Risk Monitor v1.0 — automated ingestion + analyst validation"
}
Alert Severity Framework
11. Scenario Table — CSV Format
This CSV-formatted table is suitable for import into analytical platforms, dashboards, or spreadsheet tools. All values are analyst estimates. Confidence and source fields are required in every row.
All Brent prices in USD/bbl. LNG JKM impact in % change from pre-event baseline. BDTI TD3C in % change from 90-day average. Floating storage in million barrels. Not investment advice. Research and scenario analysis only.
12. Dashboard Endpoints & Visualization Specs
The following REST endpoints and chart specifications are intended for the development team to implement during Weeks 5–6 of the pilot. All endpoints return JSON with versioning and provenance metadata.
REST Endpoints
/api/v1/alerts
Returns the last 48 hours of alert objects. Query params: ?scenario=S1|S2|S3, ?severity=HIGH|MEDIUM|LOW, ?limit=N. Response includes version, provenance, and human_review_required flags on every record.
/api/v1/scenarios
Returns current scenario probability estimates, price path percentiles, and last-updated timestamp. Scenario table as per CSV schema above. Cached 1 hour.
/api/v1/shipping
Returns AIS vessel count (validated), BDTI TD3C rate, rerouting status, floating storage estimate. Cross-validation status field: ais_validated: true|false. Quarantined vessels listed separately.
/api/v1/commodities
Returns current prices and % change from pre-event baseline for: Brent, JKM LNG, TTF gas, ammonia, urea, aluminium, methanol. Includes confidence field and source link for each data point.
/api/v1/financial-transmission
Returns credit stress indicators: Saudi/UAE/Kuwait CDS spreads, energy sector CDS composite, repo haircut estimates, MMF flow data (where available), leveraged fund margin-call risk score. All with confidence ratings.
Visualization Specifications
Chart 1 — Brent Price Path Fan Chart
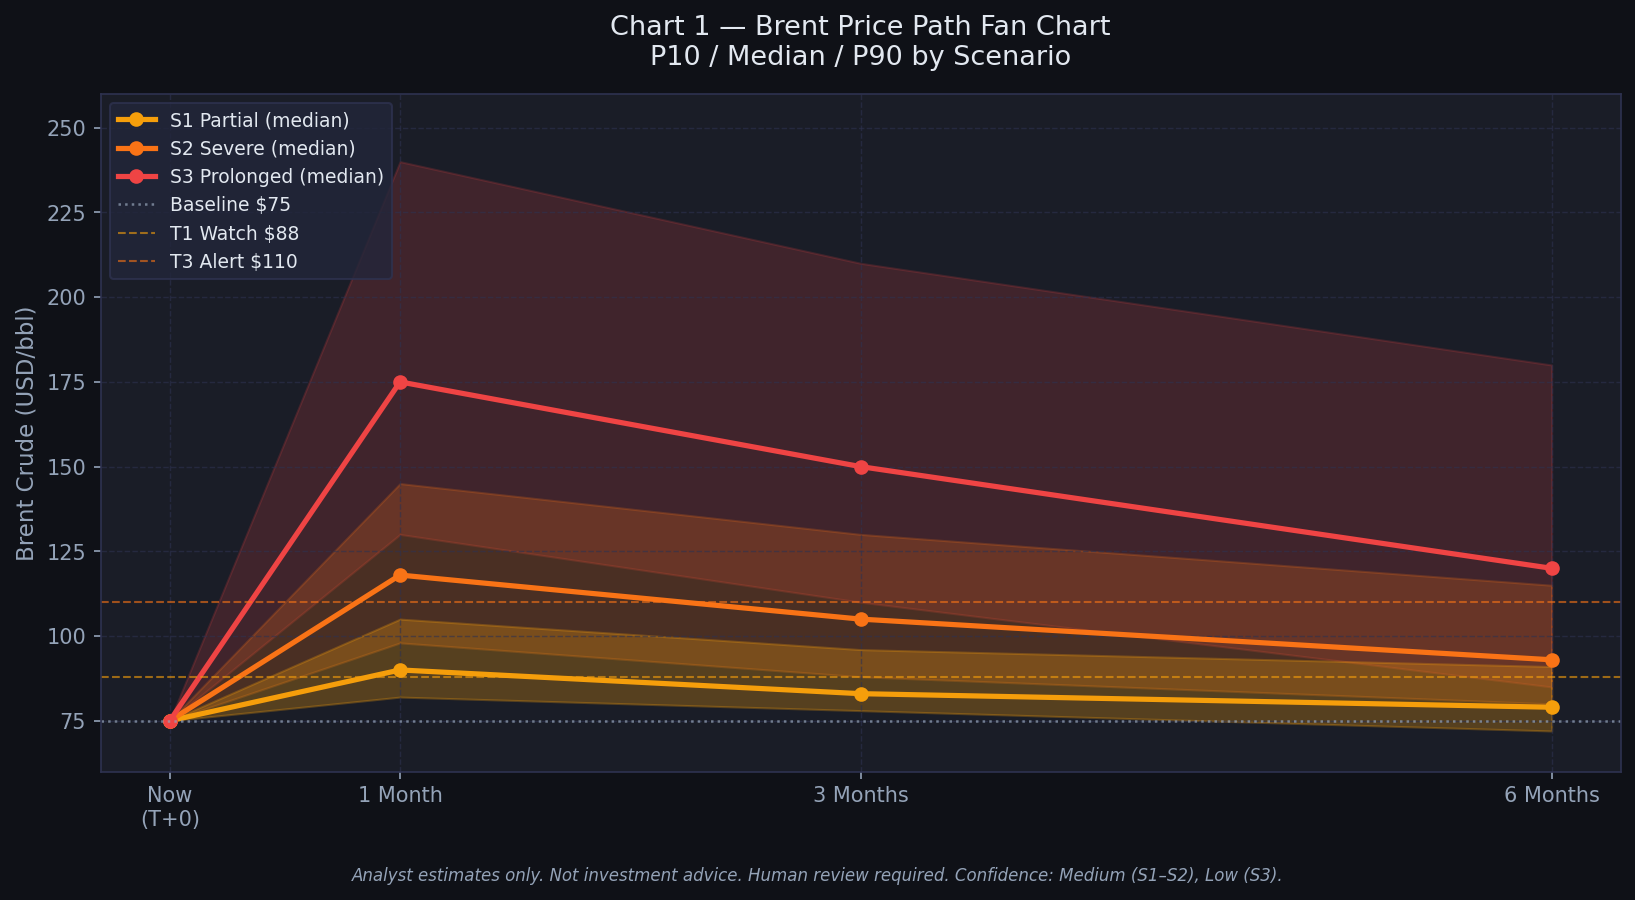
Illustrative scenario analysis — analyst estimates only. Not investment advice. Confidence: Medium (S1–S2), Low (S3).
⬇ Download chart PNG- Chart type
- Area chart with percentile bands (P10/Median/P90)
- X-axis
- Time horizon: T+0, T+1M, T+3M, T+6M
- Y-axis
- Brent crude price (USD/bbl); range 60–250
- Series
- Three scenario fan charts overlaid (S1 amber, S2 orange, S3 red); shaded band between P10–P90
- Annotations
- Baseline price marker (T+0); trigger threshold lines (T1: $88, T3: $110)
- Update frequency
- Weekly scenario refresh; daily price point
- Source data
- IEA Oil Market Report; EIA STEO; S&P Global Platts crude assessments
Chart 2 — AIS Vessel Count (30-Day Rolling)
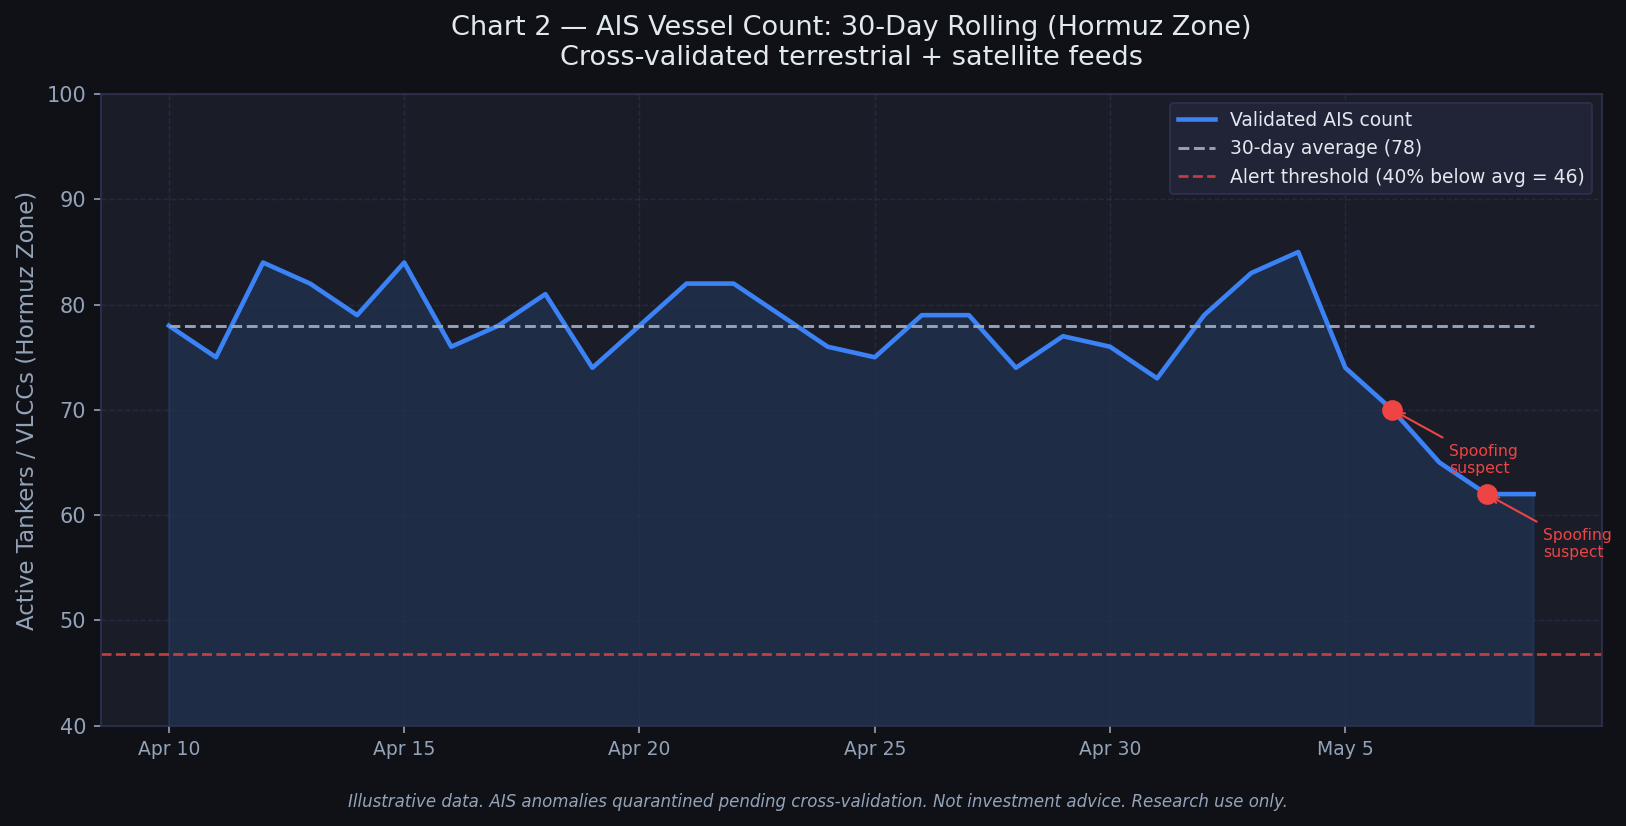
Illustrative data. AIS anomalies quarantined pending cross-validation. Research use only.
⬇ Download chart PNG- Chart type
- Line chart with anomaly markers
- X-axis
- Date (UTC, daily); rolling 30-day window
- Y-axis
- Active VLCC/tanker count transiting Hormuz zone
- Series
- Validated count (solid line); quarantined/spoofing-suspect (red dots); 30-day average (dashed)
- Annotations
- Alert threshold line (40% below average); incident markers
- Update frequency
- 6-hourly; real-time where AIS feed permits
- Source data
- MarineTraffic (terrestrial AIS); Spire Maritime (satellite AIS); cross-validated
Chart 3 — Commodity Heat Map
![Commodity heat map grid showing median percentage price impacts across seven commodities (LNG, Ammonia/Urea, Methanol, Petrochemicals, Aluminium, Copper, Food/Grain) under three disruption scenarios. Colour scale from dark green (low impact) to dark red (high impact). Each cell shows median % change and confidence rating [M] or [L].](chart3_commodity_heatmap.png)
Analyst estimates. Not investment advice. Research use only. Confidence: Medium (S1–S2), Low (S3). [M]=Medium, [L]=Low.
⬇ Download chart PNG- Chart type
- Heat map grid (commodity × scenario)
- X-axis
- Scenarios: S1, S2, S3
- Y-axis
- LNG, Ammonia/Urea, Methanol, Petrochemicals, Aluminium, Copper, Food/Grain
- Cell value
- Median % price impact; colour scale: dark green (low) → amber → dark red (high)
- Annotations
- Confidence badge [M]=Medium / [L]=Low in each cell
- Update frequency
- Weekly
- Source data
- IEA Gas Market Report; USDA; World Aluminium; ICIS petrochemical pricing
Chart 4 — CDS Spread Monitor (Time Series)
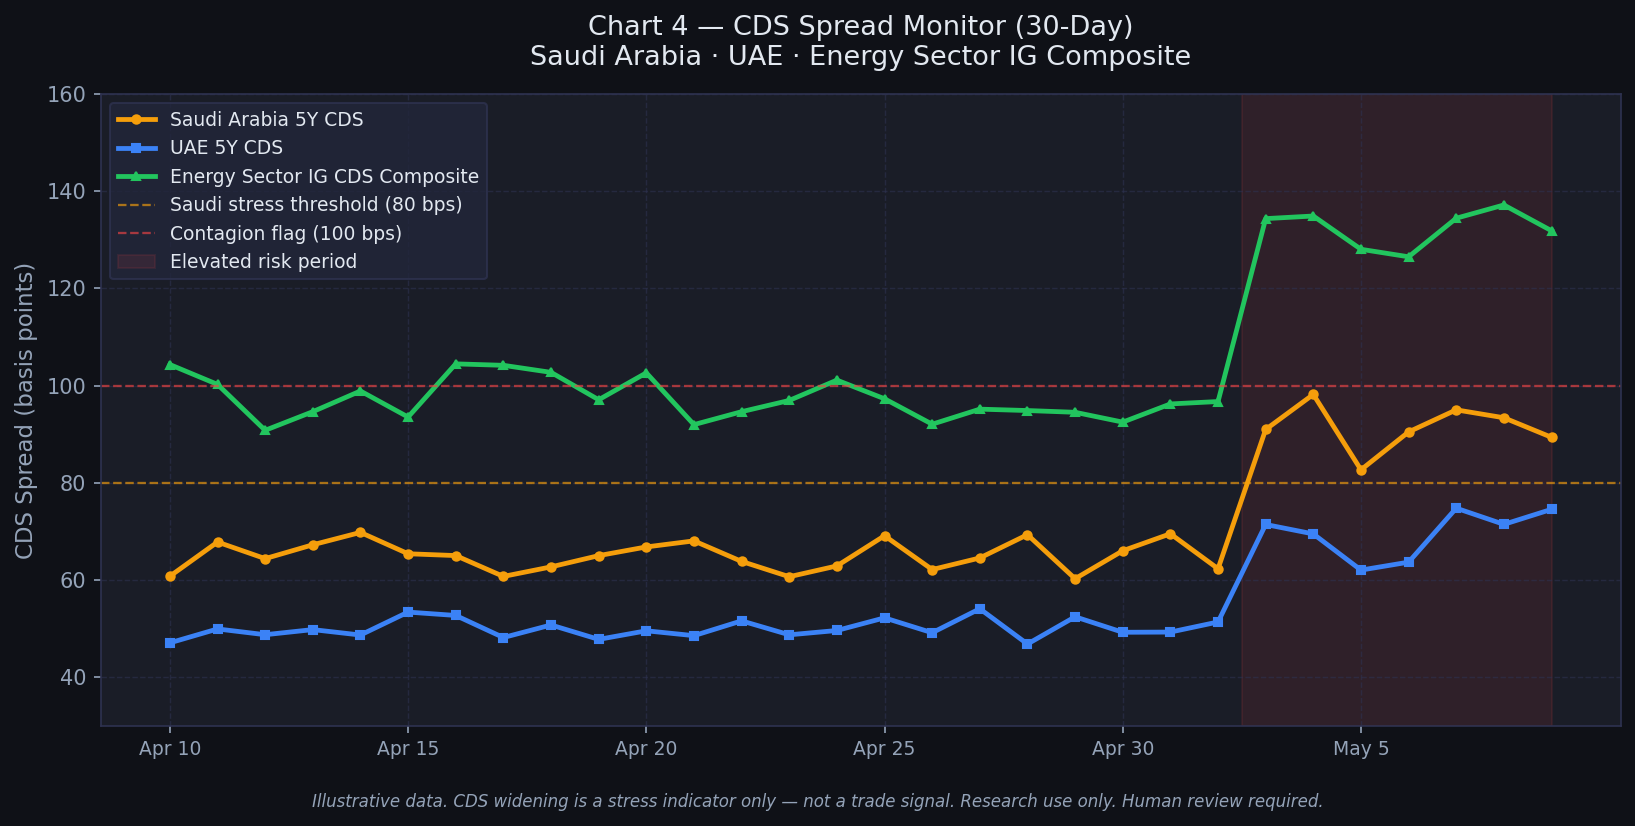
Illustrative data. CDS widening is a stress indicator only — not a trade signal. Research use only. Human review required.
⬇ Download chart PNG- Chart type
- Multi-line time series
- X-axis
- Date (UTC, daily); rolling 30-day window
- Y-axis
- CDS spread (basis points)
- Series
- Saudi Arabia 5Y CDS (amber); UAE 5Y CDS (blue); Energy Sector IG CDS composite (green)
- Annotations
- Stress threshold at 80 bps; contagion flag at 100 bps; elevated-risk period shaded
- Update frequency
- Daily (end of day)
- Source data
- Bloomberg CDS composite; corroboration from Markit/ICE where available
13. Regulatory & Official Contacts
The following organisations publish authoritative data and emergency guidance relevant to this scenario. Contact details are for information and research purposes. Verify current contact information before use — details change.
14. Six-Week Pilot Timeline
Key milestones for the research and monitoring system build-out. Assign named owners to each milestone.
/alerts, /scenarios, /shipping, /commodities, /financial-transmission) deployed and tested. First weekly brief produced.Success Metrics
| Metric | Target | Measurement Method |
|---|---|---|
| Time to first verified alert | < 72 hours | Timestamp of first alert vs. system go-live |
| AIS false positive rate | < 5% after cross-validation | Manual review of quarantined vessels; retrospective check |
| Analyst time saved per weekly brief | > 50% | Pre/post time-logging comparison; analyst survey |
| Stakeholder acceptance | Sign-off by trading desk + risk team | Formal sign-off document on file |